import org.codehaus.groovy.scriptom.*;
import org.codehaus.groovy.scriptom.tlb.office.*;
import org.codehaus.groovy.scriptom.tlb.office.powerpoint.*;

Scriptom.inApartment
{
  ppa = new ActiveXObject("PowerPoint.Application")
  ppa.Presentations.Open(new File("test1.pptx").canonicalPath,
    Scriptom.MISSING, Scriptom.MISSING, MsoTriState.msoFalse)
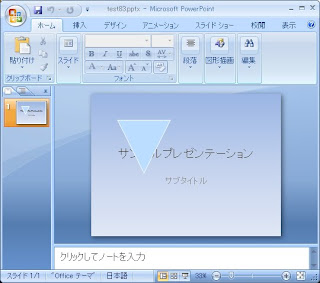
  // フロチャートの組み合わせ形を描画する
  slide = ppa.Presentations(1).slides(1)
  shape = slide.Shapes.AddShape(
    MsoAutoShapeType.msoShapeFlowchartMerge,
    100/* =left */, 100/* =top*/, 200/* =width*/, 200/* height */)

  // 線の色
  shape.Line.ForeColor.RGB = 0xffffff /* BGR*/
  // 塗りつぶし色
  shape.Fill.ForeColor.RGB = 0xffddbb /* BGR*/

  ppa.Presentations(1).saveAs(new File("test83.pptx").canonicalPath)
  ppa.Presentations(1).close()
  ppa.quit()
}
元プレゼンテーション(test1.pptx)

出力プレゼンテーション(test83.pptx)

動作環境
groovy1.7.0, JDK6 Update18, PowerPoint 2007


0 件のコメント:
コメントを投稿