2014年6月18日水曜日

JGraphXでクリックを判定する

JGraphXでクリックを判定するには、以下のコードのようにmxgc.getGraphControl().addMouseListenerを使用します。

サンプルコード
import java.awt.*
import java.awt.event.*
import javax.swing.*
import groovy.swing.*
import com.mxgraph.swing.*
import com.mxgraph.view.*
import com.mxgraph.util.mxConstants
import com.mxgraph.layout.*

def graph = new mxGraph()
def mxgc = new mxGraphComponent(graph)
mxgc.getGraphControl().addMouseListener(new MouseAdapter(){
  public void mousePressed(MouseEvent ev)
  {
    def cell = mxgc.getCellAt(ev.getX(), ev.getY())
    if( cell != null ){
      println "clicked:${graph.getLabel(cell)}"
    }
  }
})

sb = new SwingBuilder()
def frm = sb.frame(
  title: "JGraphX - detecting mouse clicks",
  visible: true,
  size: [300, 200],
  resizable: true,
  contentPane: mxgc,
  defaultCloseOperation: WindowConstants.EXIT_ON_CLOSE
){

  parent = graph.getDefaultParent()
  graph.model.beginUpdate()
  try
  {
    def v1 = graph.insertVertex(parent, null, "処理1",
      20, 20, 80, 30)
    def v2 = graph.insertVertex(parent, null, "処理2",
      170, 20, 80, 30)

    graph.insertEdge(parent, null, "正常終了", v1, v2)
  }
  finally
  {
    graph.model.endUpdate()
  }
}
実行結果

関連情報
JGraphxのダウンロードページ

2014年6月17日火曜日

SwingBuilderでツリーの背景色を設定する

SwingBuilderでツリーの背景色を設定するには、以下のコードのようにbackgroundを使用します。ノードの背景色も合わせて同じように変更します。

サンプルコード
import java.awt.*
import javax.swing.*
import javax.swing.tree.*
import groovy.swing.*

class MyNode extends DefaultMutableTreeNode
{
  MyNode(params)
  {
    super(params)
  }
  public String toString()
  {
    return userObject?.name
  }
}

sb = new SwingBuilder()
sb.edt {
  frame(
    title: "background color of tree example",
    show: true,
    resizable: true,
    size: [300, 200],
    defaultCloseOperation: WindowConstants.EXIT_ON_CLOSE
  ){
    scrollPane(){
      tree(id:"tree", rootVisible: false, background: new Color(0xff, 0xff, 0xbb))
      // ノードの背景色も同じように変更する
      tree.cellRenderer.setBackgroundNonSelectionColor(new Color(0xff, 0xff, 0xbb))
      tree.model.root.removeAllChildren()
      def node1 = new MyNode([name:"Node1"])
      node1.add(new MyNode([name:"Leaf1"]))
      node1.add(new MyNode([name:"Leaf2"]))
      tree.model.root.add(node1)
      tree.model.root.add(new MyNode([name:"Node2"]))
      tree.model.reload(tree.model.root)
      tree.expandRow(0)
    }
  }
}
実行時画面

動作環境
groovy 2.2.2, JDK 1.7 update55

2014年6月16日月曜日

JGraphXで入れ子図形の親を折り畳めないようにする

JGraphXで入れ子図形の親を折り畳めないようにするにはmxConstantsの以下の定数を使用します。
  • STYLE_FOLDABLE:折り畳み可否
サンプルコード
import java.awt.*
import javax.swing.*
import groovy.swing.*
import com.mxgraph.swing.*
import com.mxgraph.view.*
import com.mxgraph.util.mxConstants
import com.mxgraph.layout.*

def graph = new mxGraph()
def mxgc = new mxGraphComponent(graph)

sb = new SwingBuilder()
def frm = sb.frame(
  title: "JGraphX - unfoldable",
  visible: true,
  size: [200, 200],
  resizable: true,
  contentPane: mxgc,
  defaultCloseOperation: WindowConstants.EXIT_ON_CLOSE
){

  parent = graph.getDefaultParent()
  graph.model.beginUpdate()
  try
  {
    def stylesheet = graph.getStylesheet()
    // カスタムスタイル
    def style1 = [
      (mxConstants.STYLE_FOLDABLE): 0, // 折りたたみ不可
      (mxConstants.STYLE_VERTICAL_ALIGN):mxConstants.ALIGN_TOP
    ]
    stylesheet.putCellStyle("style1", style1)

    def v1 = graph.insertVertex(parent, null, "処理グループ",
      20, 10, 140, 120, "style1")
    def v2 = graph.insertVertex(v1, null, "処理1",
      10, 20, 100, 30)
    def v3 = graph.insertVertex(v1, null, "処理2",
      10, 80, 100, 30)

    graph.insertEdge(parent, null, "正常終了", v2, v3)
  }
  finally
  {
    graph.model.endUpdate()
  }
}

実行結果

関連情報
JGraphxのダウンロードページ

MapDBでインメモリDBを作成してkey-valueの設定と取得をする

MapDBでインメモリDBを作成してkey-valueの設定と取得をするには、以下のコードを実行します。

サンプルコード
@Grab(group='org.mapdb', module='mapdb', version='1.0.2')
import org.mapdb.*

// GCに影響を受けないIn-memory DBを作成
def db = DBMaker.newMemoryDirectDB().make()

// TreeMapを作成
def tm = db.getTreeMap()

// key-valueを設定
tm.put("sample1", "direct")
tm.put("sample2", "memory")
tm.put("sample3", "db")

// 値を表示
println tm.keySet().collect { it + "=" + tm.get(it) }.join(",")

関連情報
・MapDBのサイト
http://www.mapdb.org/

2014年6月15日日曜日

SwingBuilderでツリーにイメージを表示する

SwingBuilderでツリーにイメージを表示するには、以下のコードのようにcellRendererを使用します。この例ではノードを選択してもノードの文字の背景色は変わりません。

サンプルコード
import java.awt.*
import javax.swing.*
import javax.swing.tree.*
import groovy.swing.*

class MyNode extends DefaultMutableTreeNode
{
  MyNode(params)
  {
    super(params)
  }
  public String toString()
  {
    return userObject?.name
  }
}


class MyTreeRenderer implements TreeCellRenderer
{
  public Component getTreeCellRendererComponent(
      JTree tree, Object value, boolean selected,
      boolean expanded, boolean leaf, int row, boolean hasFocus)
  {
    JLabel label = new JLabel(value.toString())
    if( value instanceof MyNode ){
      if( value.getUserObject().containsKey("icon") ){
        label.setIcon(value.userObject.icon)
      }
    }
    return label
  }
}

sb = new SwingBuilder()
sb.edt {
  frame(
    title: "tree with images example",
    show: true,
    resizable: true,
    size: [300, 200],
    defaultCloseOperation: WindowConstants.EXIT_ON_CLOSE
  ){
    scrollPane(){
      tree(id:"tree", rootVisible: false, cellRenderer:new MyTreeRenderer())
      tree.model.root.removeAllChildren()
      def node1 = new MyNode([name:"Node1", icon:imageIcon(file:"e:/icons/home.png")])
      node1.add(new MyNode([name:"Leaf1", icon:imageIcon(file:"e:/icons/plane.png")]))
      node1.add(new MyNode([name:"Leaf2", icon:imageIcon(file:"e:/icons/mobile2.png")]))
      tree.model.root.add(node1)
      tree.model.root.add(new MyNode([name:"Node2", icon:imageIcon(file:"e:/icons/chat-.png")]))
      tree.model.reload(tree.model.root)
      tree.expandRow(0)
    }
  }
}
実行時画面

動作環境
groovy 2.2.2, JDK 1.7 update55

2014年6月14日土曜日

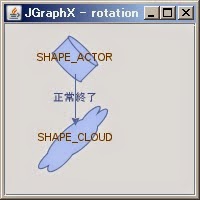
JGraphXで図形を回転させる

JGraphXで図形を回転させるにはmxConstantsの以下の定数を使用します。
  • STYLE_ROTATION:回転角度
サンプルコード
import java.awt.*
import javax.swing.*
import groovy.swing.*
import com.mxgraph.swing.*
import com.mxgraph.view.*
import com.mxgraph.util.mxConstants
import com.mxgraph.layout.*

def graph = new mxGraph()
def mxgc = new mxGraphComponent(graph)

sb = new SwingBuilder()
def frm = sb.frame(
  title: "JGraphX - rotation",
  visible: true,
  size: [200, 200],
  resizable: true,
  contentPane: mxgc,
  defaultCloseOperation: WindowConstants.EXIT_ON_CLOSE
){

  parent = graph.getDefaultParent()
  graph.model.beginUpdate()
  try
  {
    def stylesheet = graph.getStylesheet()
    // シェイプのカスタムスタイル
    def style1 = [
      (mxConstants.STYLE_SHAPE): mxConstants.SHAPE_CYLINDER,
      (mxConstants.STYLE_ROTATION): 45,
    ]
    stylesheet.putCellStyle("style1", style1)
    def style2 = [
      (mxConstants.STYLE_SHAPE): mxConstants.SHAPE_CLOUD,
      (mxConstants.STYLE_ROTATION): 135,
    ]
    stylesheet.putCellStyle("style2", style2)

    def v1 = graph.insertVertex(parent, null, "SHAPE_ACTOR",
      50, 20, 40, 30, "style1")
    def v2 = graph.insertVertex(parent, null, "SHAPE_CLOUD",
      20, 100, 100, 30, "style2")
    graph.insertEdge(parent, null, "正常終了", v1, v2)

  }
  finally
  {
    graph.model.endUpdate()
  }
}
実行結果

関連情報
JGraphxのダウンロードページ

2014年6月13日金曜日

SwingBuilderでフレームウインドウを最大化する

SwingBuilderでフレームウインドウを最大化するには、以下のコードの様にextendedStateにJFrame.MAXIMIZED_BOTHを設定します。

サンプルコード
import javax.swing.*
import groovy.swing.*

sb = new SwingBuilder()
sb.edt {
  frame(
    title: "maximized jframe example",
    show: true,
    resizable: true,
    size: [300, 200],
    defaultCloseOperation: WindowConstants.EXIT_ON_CLOSE,
    extendedState: JFrame.MAXIMIZED_BOTH
  ){
    label(text:"maximized jframe")
  }
}
実行時画面

動作環境
groovy 2.2.2, JDK 1.7 update55